
OSD3358-SM-RED Board Demo. So Easy Even Marketing Can Do It!
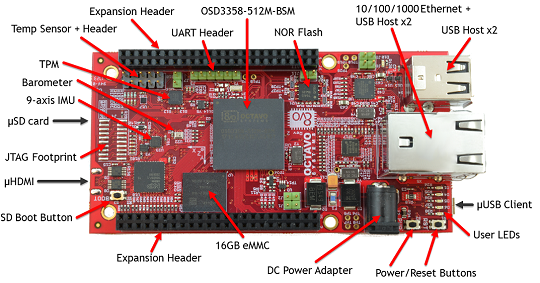
The OSD3358-SM-RED is our Reference, Evaluation and Development platform for the OSD335x Family of System-in-Package (SiP) devices. It was designed to make it easy for anybody with some knowledge or a desire to learn to begin developing applications on the OSD335x family of SiPs. In fact, it is so easy to use even a Marketing Person like me can quickly develop on it!
Need for a Demo
We were getting ready to attend our first tradeshow after the launch of the OSD3358-SM-RED and wanted a demo to show off its features. The applications team was busy working on different projects and supporting customers through their development process, so I took it upon myself to put a demo together.
Now to be fair I do have a degree in Computer Engineering, but it has been a long time and my degree plan had not included embedded software development, so this was definitely uncharted territory for me.
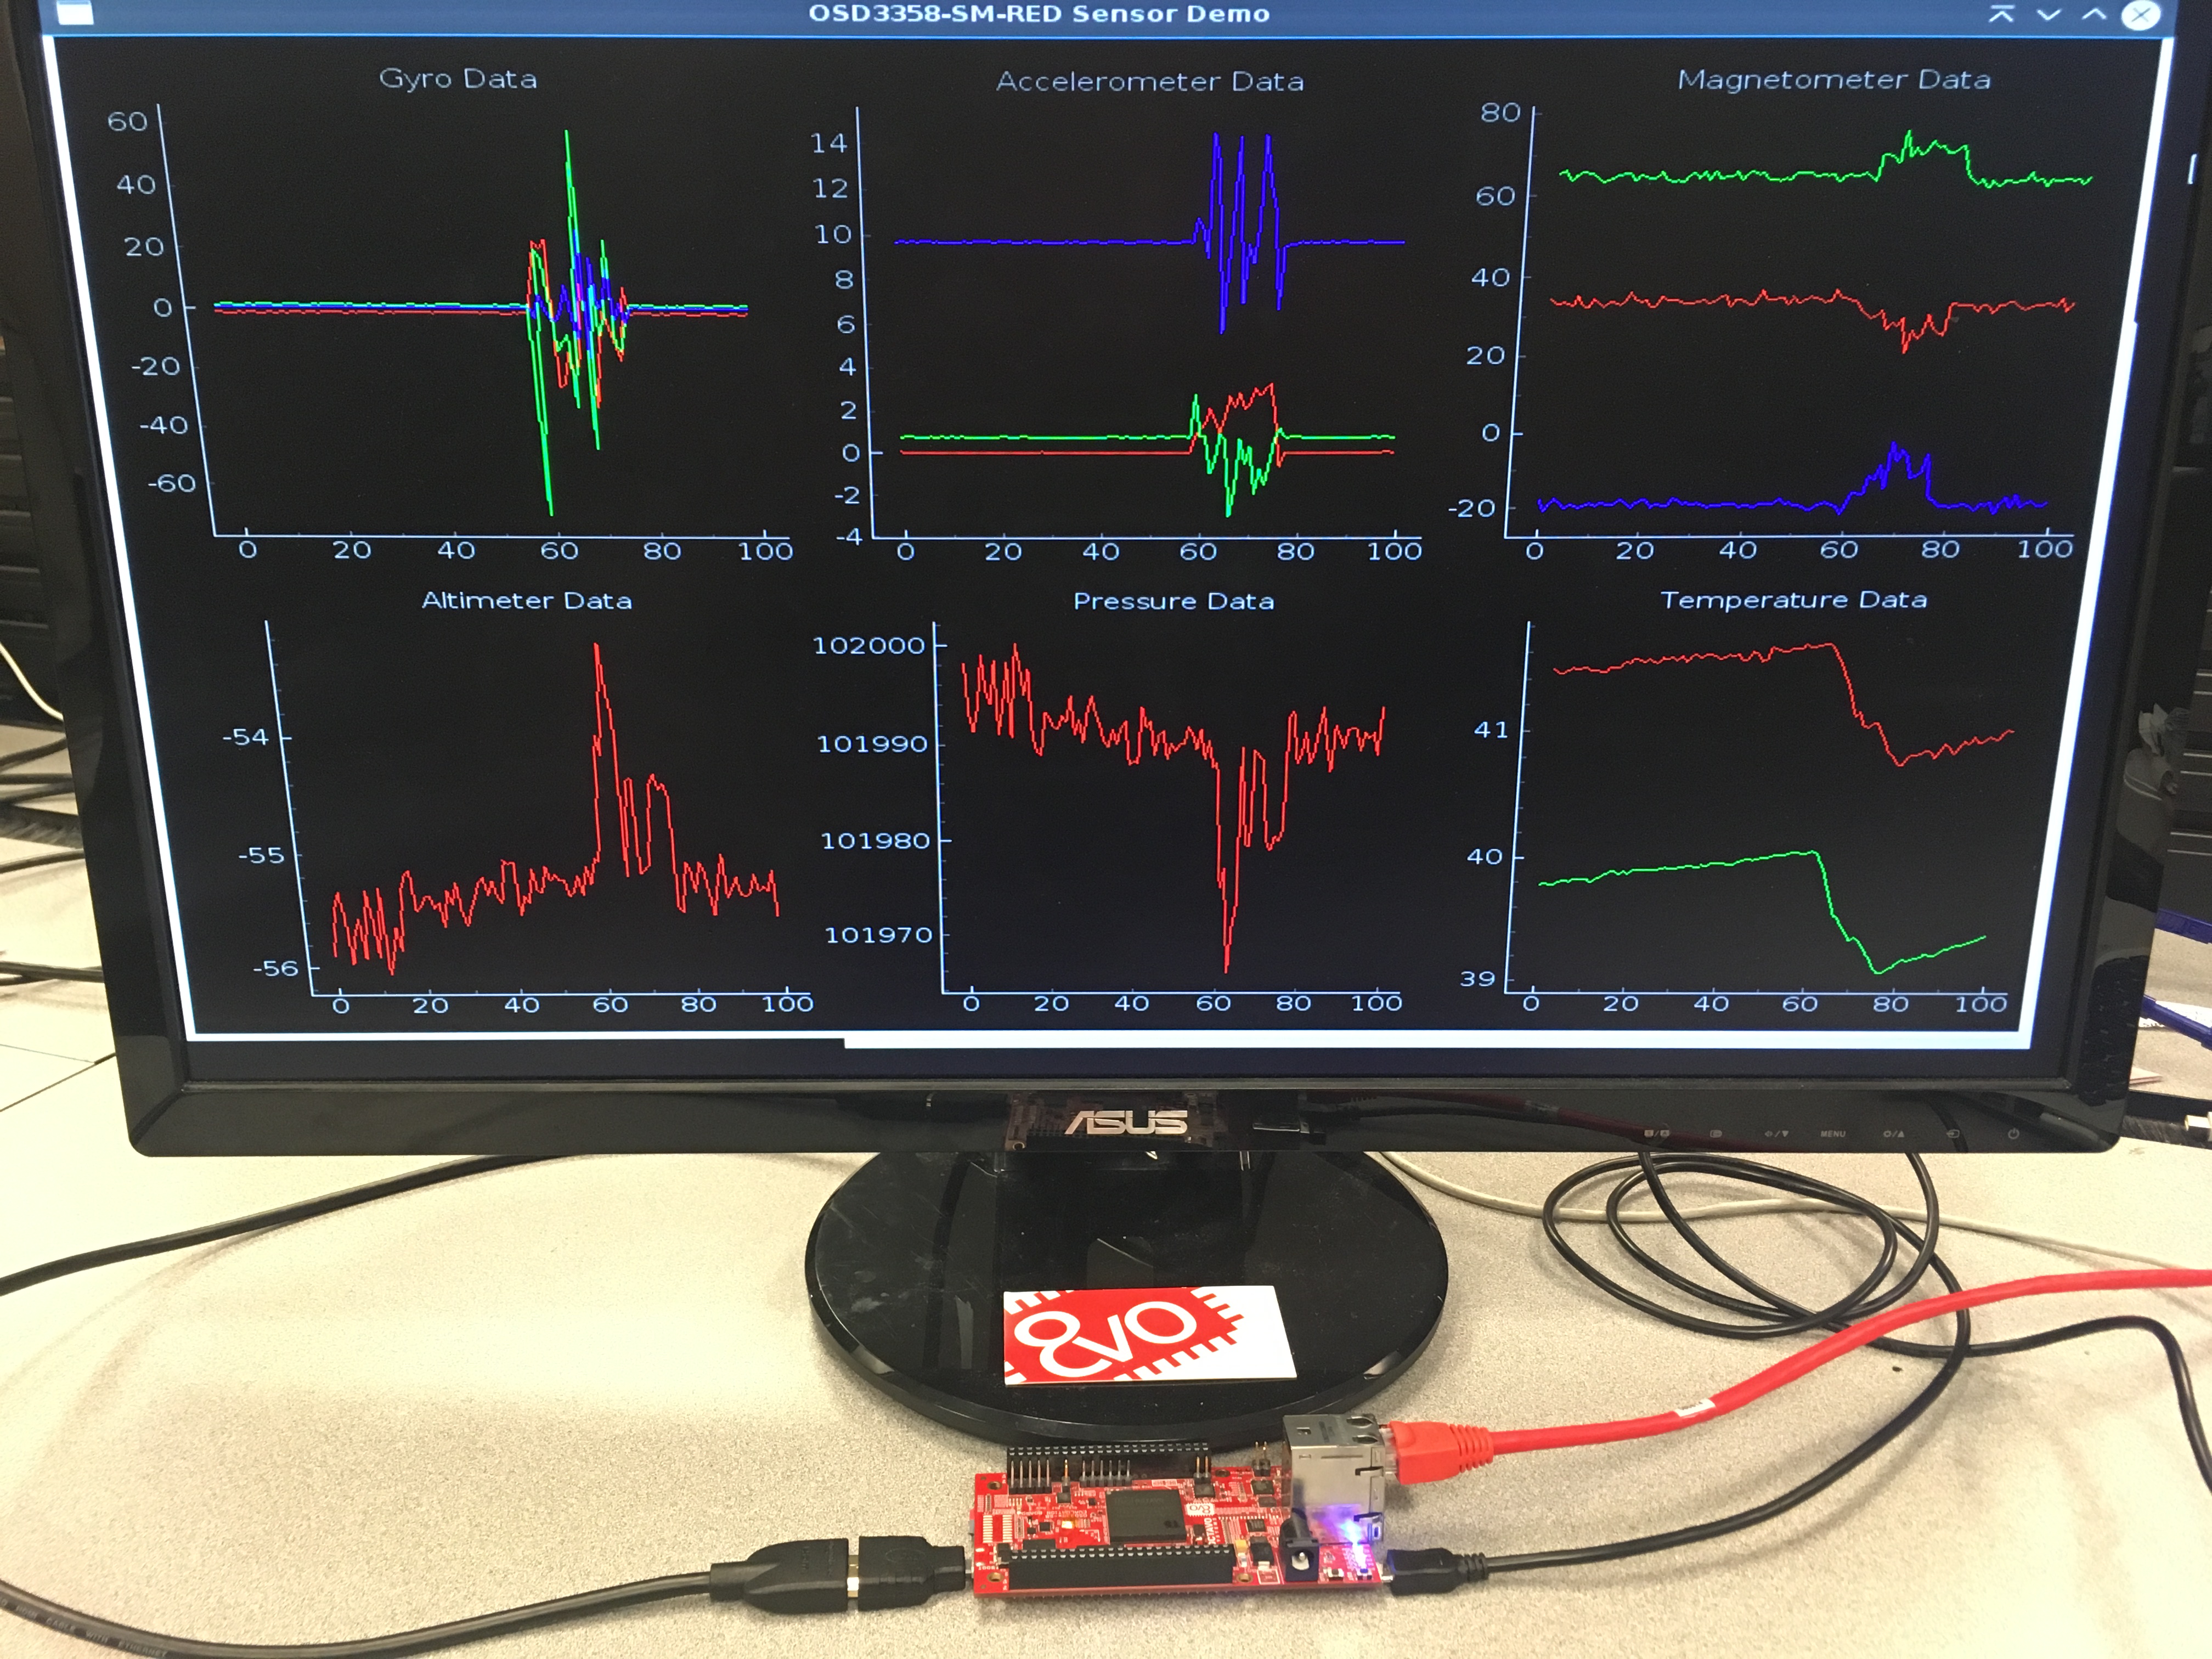
Given my lack of experience I wanted a demo that I could easily pull together, demonstrated some of the features of the RED board, and could get people’s attention at a trade show. I decided to hook the RED board to a monitor using its micro-HDMI port and display graphs that show the various readings from the onboard IMU and barometer sensors.
The OSD3358-SM-RED board comes pre-loaded with a version of Debian Linux that supports a full GUI allowing it to act like a PC. With access to hundreds of open-source libraries, I was able to use Python, which was familiar to me from the PC world.
Therefore, even though I had no experience with embedded computing and would have started from scratch if this was a microcontroller, working with this system allowed me to treat the project as a standard PC software project.
Interfacing with Sensors
Now that I had a plan in place for overall software development and IDE, I needed to tackle another unfamiliar area; polling the sensors and getting the data from them. This task is back in the realm of embedded development again. It would require me to set up I2C interfaces and setting up and reading registers, all of which are outside of my comfort zone.
Luckily for me the OSD3358-SM-RED comes with examples that demonstrate how to interface with the on-board sensors and peripherals. They are all written in C and use a common library to interface with all of the peripherals. Having this library is the key. It abstracts all of that low-level stuff that you would normally have to do to interface with these sensors and makes it just a couple of simple function calls. The library is called libredperipherallib.so.
Luckily Python provides a mechanism that allows you to call C functions from within Python. This is the CDLL function. With all of this in mind I pulled together my first Python Module, REDperipherals.py, which acted as an interface between python and the C functions that I needed to use to get the sensor data I needed.
Collecting and Displaying Data
Now that I had a way to interact with the hardware sensors from Python, the rest of the project was easy. It was a pure PC type project using Python.
The next module I created was a simple one with 2 functions called sensor_reader.py. The functions in it would use the REDperipherals.py module to actually poll the data from the sensors and package them into a dictionary that could be passed back to another function. This provided a nice abstraction from the actual interaction with the sensors.
Finally, I pulled together the GUI to display line graphs for the different pieces of information. My code pulls in the Accelerometer, Magnetometer, Gyro, and Temp data from the IMU and Altitude, Pressure, and Temperature from the Barometer. This gave me 6 graphs each with multiple series displayed on them.
I wanted the graphs to update automatically and scroll across the screen as the data updated. I did a lot of research on libraries that would allow me to easily build these types of graphs and settled on pyqtgraph. It is a powerful graphing package built on top of the QT framework. This makes the graphs very efficient allowing them to continually update at a reasonable frame rate.
The GUI and the main program is in the module REDSensorDisplay. In this module I built a number of different arrays for the various graphs series displayed. Wanting less than 100 readings per series to be shown, I set that variable as well. I then create the different plots and curves as defined by pygraphqt.
There are a series of functions that obtain the sensor data and updates the charts. The threading Timer was then set to poll the sensors and update the charts every 50 milliseconds.
Finally, in the Main function the sensors are initialized, and the timer is started.
The program runs continually polling and updating the charts. Success!
Summary and Code Download
The title of this article might be a little misleading. I am not sure I could have done this if I didn’t have some experience with PC programming. However, I definitely didn’t have any experience in embedded development and interfacing with real world sensors. The OSD3358-SM-RED with its Linux distribution and the preinstalled libraries abstracted all of the hard-core embedded stuff away from me and allowed me to develop my own embedded sensor application in a couple of hours!
![]()
![]() Code for this project can be downloaded from our website
Code for this project can be downloaded from our website
We look forward to hearing how your experience is getting started with the OSD3358-SM-RED. Please contact us for support to make your design experience as easy as possible with the OSD335x Family of devices.
You can also sign up for our mailing list or follow us on Facebook, Twitter, or Linked In.